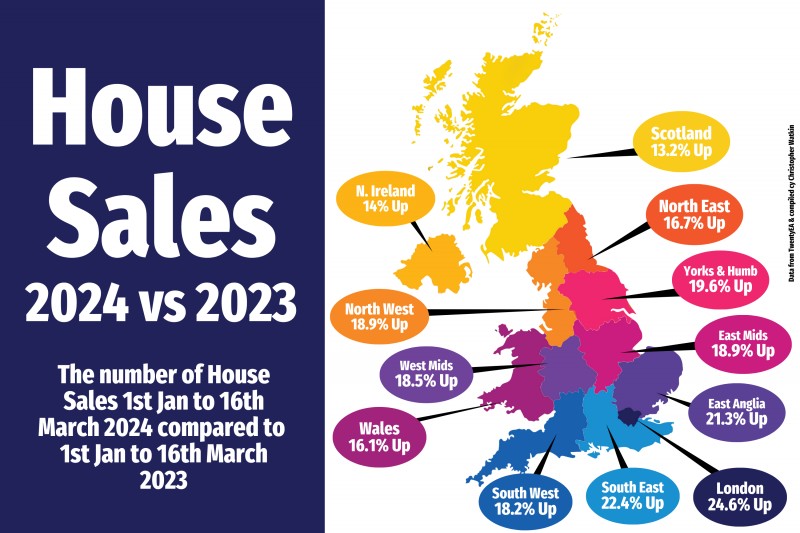
This informative graphic illustrates the buoyancy of the property market across the United Kingdom for the early part of 2024, specifically from the 1st of January to the 16th of March. compared to the same period in 2023.
Over that time frame, there has been a 19.4% increase in UK house sales agreed from 203,254 in 2023 to 242,803 in 2024.
This uplift has been across all regions, with the most significant rise in London, showcasing a remarkable 24.6% increase, which could reflect a strong economic recovery post-pandemic or possibly the effects of changing housing needs as remote work continue to influence homebuyer preferences.
The South East and East Anglia regions also saw substantial growth, with increases of 22.4% and 21.3% respectively, suggesting a continued trend of desirability for these areas, possibly driven by their relative proximity to London while offering more space and value for money. This could also be indicative of the 'ripple effect', where the heat of the London market spreads to surrounding regions.
Notably, the North has witnessed a healthy surge, with Yorkshire & the Humber at 19.6% and the North West at 18.9% and North East at 16.7%, hinting at a decentralisation of market activity, possibly due to buyers seeking more affordable options or the rise of regional economic hubs.
The South West, Midlands (both West and East), show parallel trends with increases of 18.2%, 18.5% and 18.9% respectively, which might reflect regional developments and investments in infrastructure making these areas more attractive to buyers.
Even regions with smaller growth, such as Wales, Northern Ireland & Scotland, with 16.1%, 14% and 13.2% increases respectively, are seeing positive movement, underscoring the nationwide robustness of the property market.
This graphic represents a UK property market that is thriving post-pandemic, with a significant appetite for home purchases across the UK, likely fuelled by a combination of low-interest rates, changing lifestyle needs, and possibly government incentives.
For more local up to date statistics on the Romford property market, follow GBP Estates on social media for regular updates regarding Romford house prices and transaction levels.